


By Sébastien Manjony, Technical Director at Prodware
In this article, I will explain how to set up monitoring and telemetry for Dynamics 365 Finance and Operations using Application Insights.
Monitoring D365 Finance and Operations is a strategic priority to ensure performance and reliability. Microsoft offers a powerful solution for this: Application Insights. This tool, part of Azure Monitor, enables in-depth analysis of application telemetry, identification of performance issues, and error diagnostics.
Why Use Application Insights?
Application Insights is a key tool for monitoring performance and tracking errors in D365 Finance. It enables:
- Proactive application monitoring
- In-depth analysis of user interactions
- Fast detection of performance issues and errors
- Custom dashboards to visualize critical data
Solution Architecture
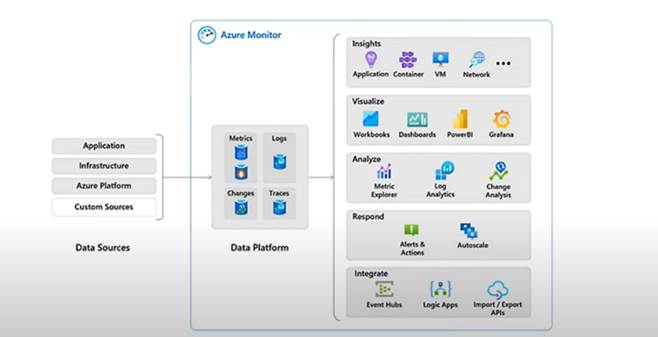
Let’s start with a general overview of Application Insights. As part of Azure’s Application Performance Management (APM) tools, Application Insights collects application telemetry and metrics, providing visibility into the health and activity of your applications.
Below is a snapshot of the various tools and extensions available within Azure Monitoring, which includes Application Insights.
D365 Finance and Operations now offers a native integration with Application Insights. This point-to-point connection links a specific F&O instance to a dedicated Application Insights resource. Each Application Insights instance has a unique instrumentation key, which is configured in the F&O settings.
Data Sources
Application Insights collects telemetry from several sources:
- D365 Finance applications
- Azure platform components
- Infrastructure
- Custom sources specific to Dynamics
This data is ingested into Azure Monitor and stored in a Log Analytics workspace.
Data Usage
Collected data can be leveraged through:
- Configurable alerts
- Visualizations in Power BI or Azure Data Explorer
- Automated actions via Logic Apps
Installing and Configuring Application Insights
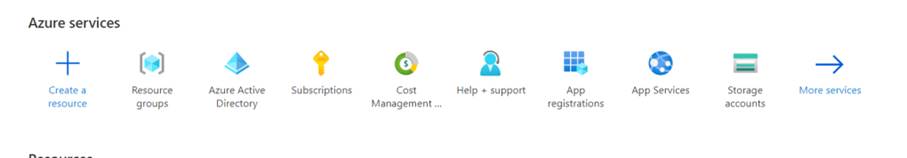
Step 1: Create a Resource Group
Log into your Azure portal and create a new Resource Group. This will be used to organize telemetry and monitoring-related resources.
Step 2: Create the Application Insights Resource
Once the resource group has been created, add a new Application Insights resource.Add a new Application Insights resource. This resource will collect, analyze and visualize D365 Finance telemetry data.
Below is the step-by-step process for configuring and activating it:
- Connect to the Azure portal and create a new resource
- Select the appropriate resource group and give it an appropriate name for a simplified use.
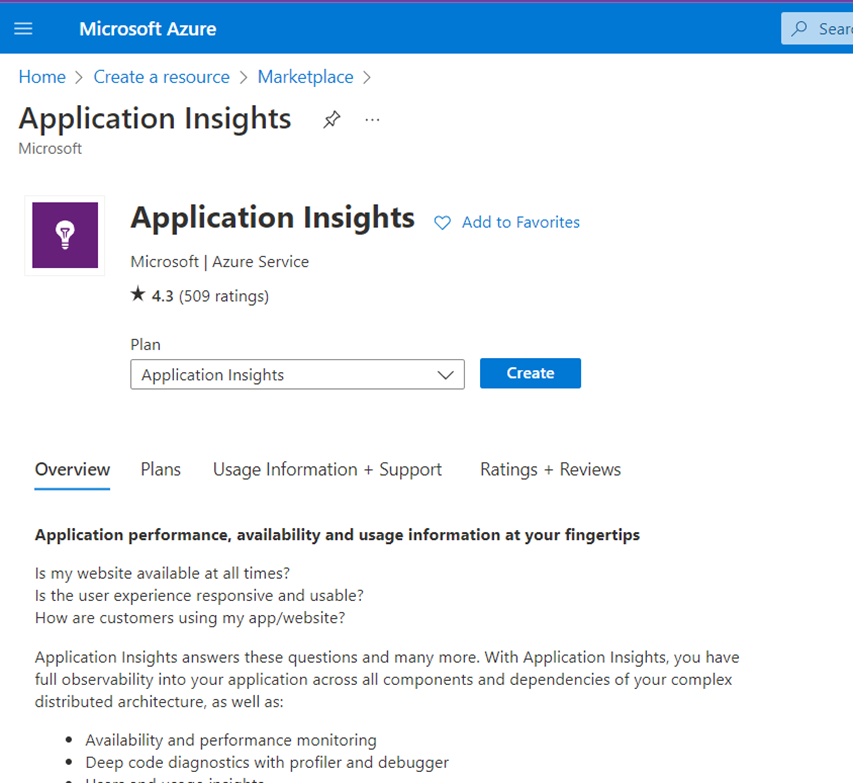
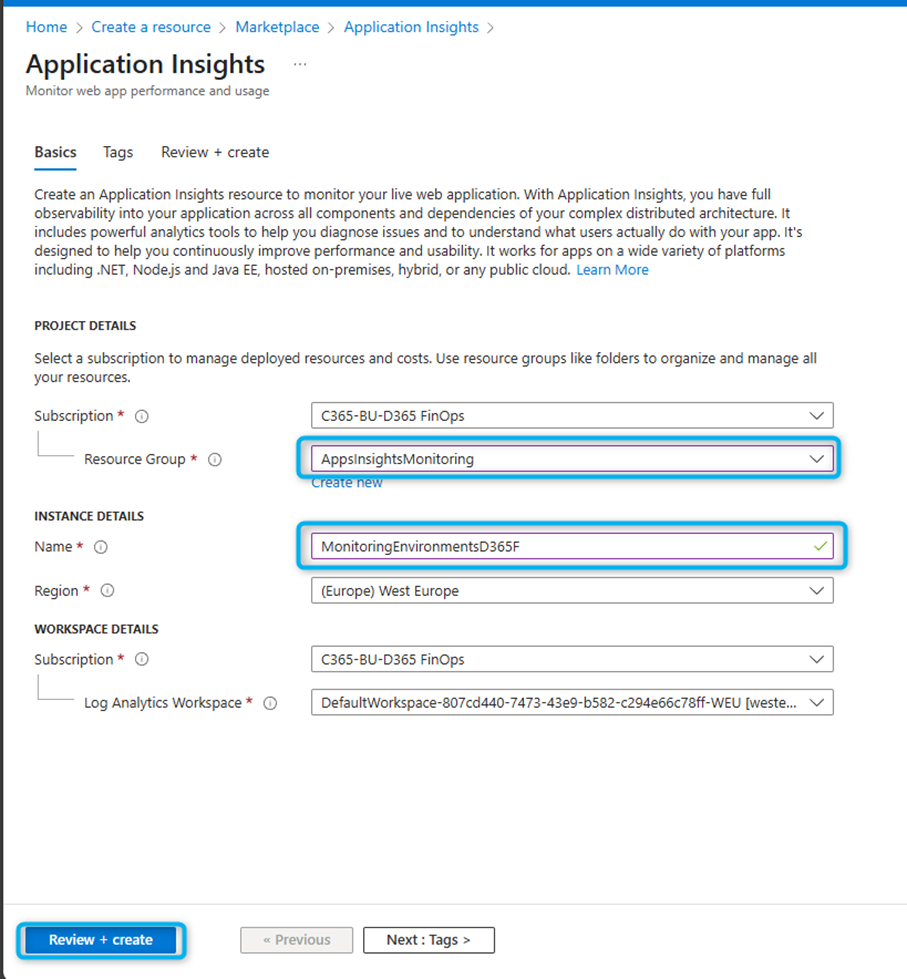
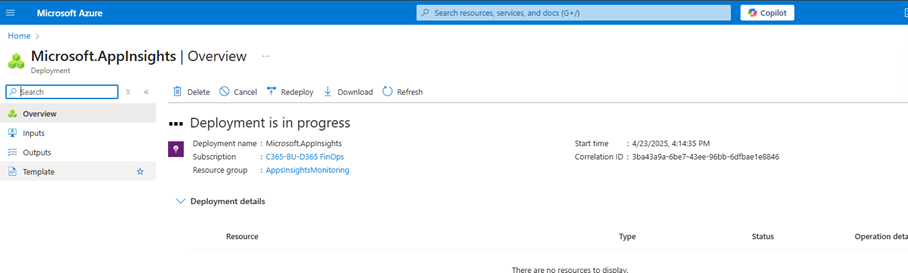
3. Click “Review + Create”. Deployment takes just a few minutes.
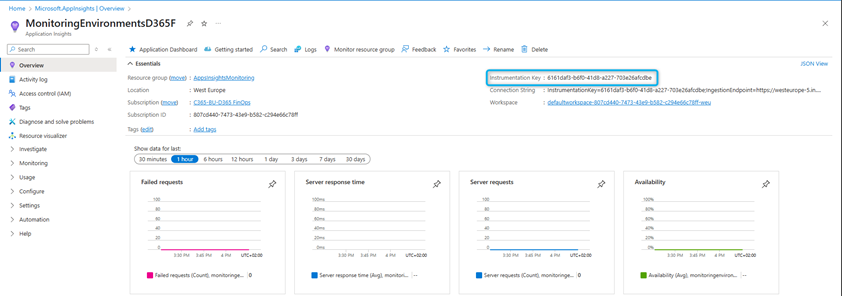
4. After deployment, copy the instrumentation key for later use.
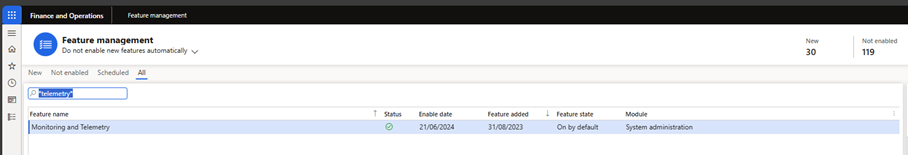
Step 3: Enable the Feature in D365
Go to Settings > Feature Management and enable the telemetry and monitoring feature.
Step 4: Configure Telemetry Screens
- Navigate to: System Administration > Setup > Monitoring and Telemetry Parameters

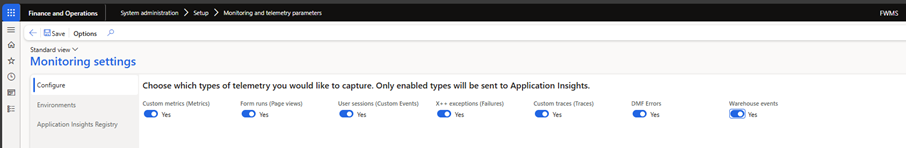
This form includes three tabs: Configuration, Environments, and Application Insights Registry.
- In the Configuration tab, select which types of telemetry to collect (e.g., page views, exceptions).
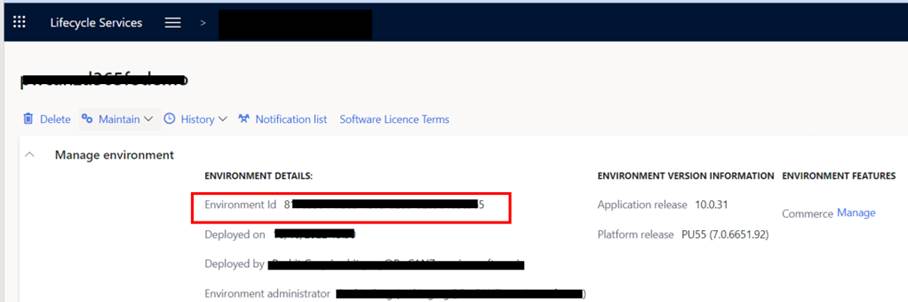
- In the Environments tab, enter the Environment ID and Mode. You can find this ID in LCS under environment details. This configuration is particularly helpful for managing database restore scenarios in non-production environments.
Copy the environment ID as shown below from LCS
- Create a log in the “Environments” tab. This is a practical solution for managing database restore scenarios. This configuration is retained in non-production environments.
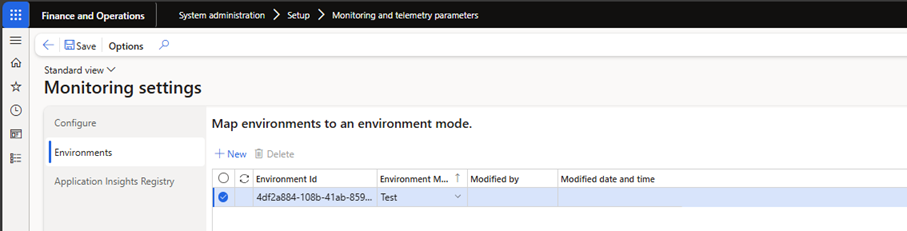
Environment mode is important, as it links the environment to the application information in the next tab. So, if you want several environments to send telemetry data to the same Application Insights resource, you can do so.
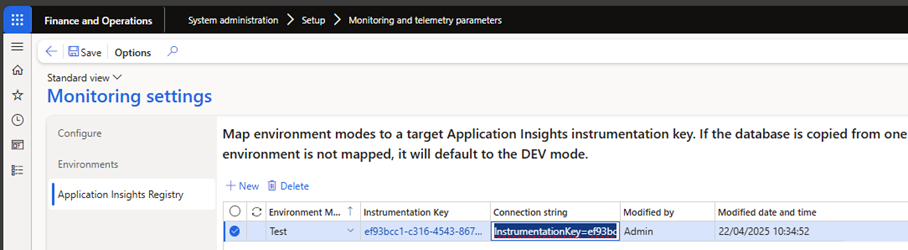
- In the third tab, we need to define the mode and link it to the instrumentation key we copied from the Azure portal after creating the resource. Associate this ID with the Application Insights connection chain obtained in Azure.
It may take a few moments for telemetry data to appear in the Azure portal, but once active, it provides valuable insights into your environment.
Further analysis, custom dashboards and queries can be integrated into application analysis for more targeted information. X++ developers can also log custom code exceptions to feed telemetry. It will be interesting to see how Microsoft converges application monitoring functionality between Dynamics 365 applications.
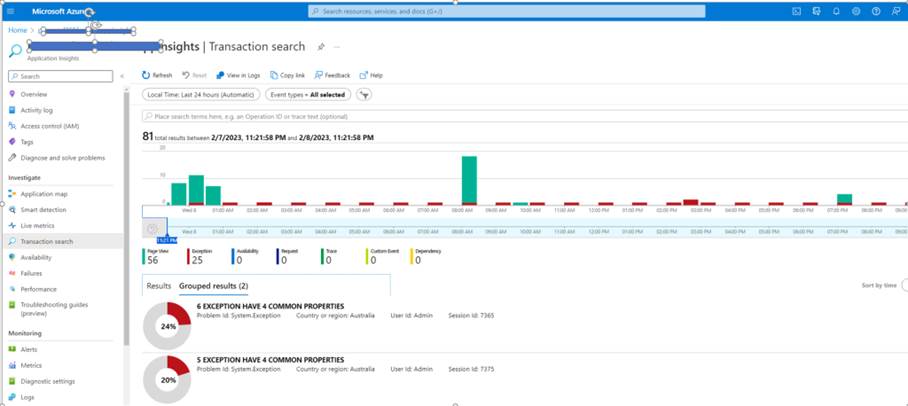
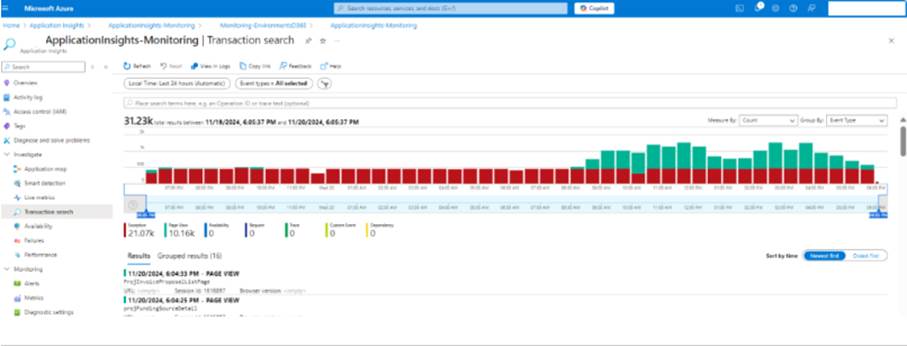
Visualizing and Analyzing Data
Once configured, you’ll be able to view detailed telemetry data, including usage statistics, process performance, and other key indicators.
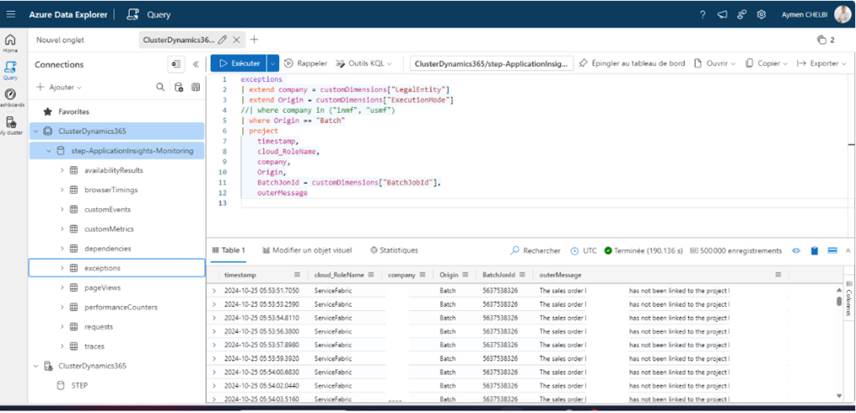
Kusto Query Language (KQL)
If you’re familiar with Kusto Query Language (KQL), you can connect to an Azure Data Explorer cluster and run advanced queries for deeper analysis.
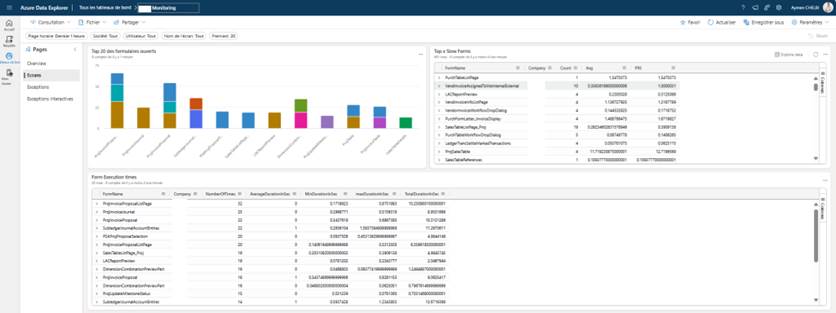
This allows the creation of custom dashboards with detailed visualizations like the one shown below:
Adding Custom Telemetry
To track specific business processes, Application Insights supports custom metrics via API.
Best Practices for Effective Monitoring :
- Define relevant KPIs: Response times, error rates, request latency.
- Implement smart alerts: Use machine learning-based thresholds.
- Automate diagnostics: Use KQL to create detailed reports.
- Integrate with ITSM tools: Connect with platforms like ServiceNow, FreshService, etc.
- Train your teams: Build expertise in telemetry analysis and log interpretation.
Microsoft FastTrack teams are currently developing downloadable monitoring templates for use in Azure Data Explorer.
Application Insights is a vital tool for monitoring D365 Finance applications. Its deep integration with Azure Monitor and high flexibility make it possible to optimize performance, quickly detect issues, and enhance the overall user experience.


